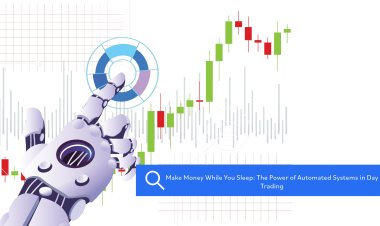

The Best Trading Strategy for 2023
Discover the importance of footprint charts in the trading world. Learn about their functions, their combination with order flow, and related trading decisions based on market stories.
 admin
admin
The Best Trading Strategy for 2023
Understanding the Role and Importance of Footprint Charts
Candlesticks are the first thing traders focus on when analysing price movements in the financial markets. However, there is another important concept called footprint charts that can provide valuable insights for traders.
Footprint charts help traders understand who is in control of the market, whether it is the buyers or the sellers. These charts display the volume and price information in a way that allows traders to see the order flow dynamics at each price level.
By examining the footprint charts, traders can gain a deeper understanding of market dynamics and make more informed trading decisions. These charts provide a real-time view of the market participants' actions, revealing the aggressiveness of buyers and sellers.
Traders analyse the depth of market, time, and sales data to identify aggressive buying and selling. Footprint charts show every executed order, allowing traders to see the exact volume transacted at each price level. This information is crucial for understanding market sentiment and identifying potential trading opportunities.
In addition to volume information, footprint charts also provide insights into the delta, which is the difference between the bid and ask orders. Delta helps traders determine who is in control at each level, whether it is the buyers or the sellers. By monitoring the changes in delta, traders can identify shifts in power and potential reversals in price.
When analysing footprint charts, traders look for changes in aggressiveness, the presence of strong buyers or sellers, and any trap participants on the chart. These insights allow traders to anticipate potential price movements and adjust their trading strategies accordingly.
However, it's important to note that footprint charts should not be used in isolation. They should be combined with market structure and context to make informed trading decisions. Understanding the supply and demand levels and identifying balance and imbalance sessions are also crucial for successful trading.
Ultimately, the market tells a story, and it's the trader's job to read the market and make trading decisions based on the available information. Footprint charts provide a powerful tool for understanding order flow dynamics and gaining a competitive edge in the financial markets.
How a Combination of Footprint Charts and Order Flow Impacts Trading
Footprint charts, when combined with order flow analysis, can provide traders with a deeper understanding of price movements and market dynamics. Order flow refers to the actual buying and selling activities happening in the market, and it plays a crucial role in determining market direction.
By incorporating order flow analysis into their trading strategies, traders can gain insights into market sentiment, identify potential reversals, and make more accurate predictions about future price movements. Let's explore how the combination of footprint charts and order flow impacts trading.
When analysing the order flow, traders focus on the depth of the market, time, and sales data to identify the aggressiveness of buyers and sellers. Footprint charts complement this analysis by displaying the volume transacted at each price level, allowing traders to see the intensity of buying and selling pressure.
Traders often look for patterns and anomalies in the order flow, such as large buyers or sellers entering the market or a sudden increase in volume. These patterns can signal potential trend reversals or the presence of significant market players.
For example, if there is a surge in buying volume at a specific price level on the footprint chart, it indicates strong demand from buyers. This information can suggest a potential support level and may prompt traders to enter long positions or tighten their stop-loss orders.
Conversely, if there is a spike in selling volume accompanied by a price decline, it suggests aggressive selling pressure. Traders can use this information to identify potential resistance levels and consider short positions or protective measures.
The combination of footprint charts and order flow analysis allows traders to see the market microstructure and understand how buying and selling activities unfold in real-time. This information can help traders anticipate breakouts, spot potential reversals, and identify areas of high liquidity.
Moreover, by closely monitoring the order flow dynamics, traders can spot any hidden intentions or trading strategies of institutional investors or market makers. Understanding how these players operate can provide valuable insights that help traders align their positions with the dominant market forces.
It's vital to note that order flow analysis using footprint charts requires experience and skill. Traders need to interpret the information accurately and make informed trading decisions based on the combined analysis. Developing proficiency in order flow analysis takes time and practice.
The combination of footprint charts and order flow analysis can significantly impact trading outcomes. By understanding the order flow dynamics, traders can gain an edge in the market and make more informed decisions. Properly incorporating these tools into trading strategies can help traders identify high-probability trading opportunities and manage risk effectively.
Analysing Market Data Through Footprint Charts
Footprint charts provide traders with a detailed view of market data, allowing for a deeper analysis of price movements and the behaviour of market participants. By closely examining these charts, traders can gain valuable insights into market dynamics and make more informed trading decisions. In this chapter, we will explore the process of analysing market data through footprint charts.
One of the primary benefits of using footprint charts is that they display every executed order at each price level. This information helps traders understand the level of activity and the balance between buyers and sellers at different price points.
When analysing market data through footprint charts, traders pay close attention to volume clusters. Volume clusters represent areas where substantial trading activity has occurred. These areas often act as support or resistance levels, as they signify areas of significant buyer or seller interest.
Additionally, the shape and distribution of volume within the footprint chart can provide valuable insights. For example, a footprint chart with a wide volume distribution indicates broad participation from market participants, suggesting a more reliable and sustainable price movement.
Traders also analyse the footprint chart to identify patterns and trends. By examining the patterns formed by volume and price action, traders can identify potential breakout or reversal patterns. These patterns can be used as entry or exit signals, allowing traders to take advantage of high-probability trading opportunities in the market.
Moreover, footprint charts provide visibility into the time and sales data, which shows the sequence of executed trades. This data helps traders identify aggressive buying or selling as well as any significant changes in market sentiment. Traders look for instances where large-volume trades are executed rapidly, indicating increased interest or urgency among market participants.
It's important to note that while analysing footprint charts, traders should also consider the broader market context and other technical indicators for confirmation. The combination of multiple sources of data can enhance the accuracy and reliability of trading decisions.
Furthermore, understanding market structure is crucial when analysing market data through footprint charts. Traders should be aware of key support and resistance levels, trend lines, and other market patterns that can influence price movements. Combining this knowledge with the insights gained from the footprint chart analysis can lead to a more comprehensive understanding of market dynamics.
Analysing the market data through footprint charts provides traders with detailed insights into price movements, volume, and order flow dynamics. By carefully examining these charts and considering the broader market context, traders can make more informed trading decisions. Incorporating footprint chart analysis into a comprehensive trading strategy can significantly enhance trading outcomes and improve overall profitability.
Understanding Supply, Demand, and Market Balance
In the world of trading, understanding the dynamics of supply and demand is essential for making informed decisions. Footprint charts provide valuable insights into supply, demand, and market balance, helping traders identify key levels and potential trading opportunities. In this chapter, we will delve into the importance of understanding supply, demand, and market balance when using footprint charts.
Supply and demand represent the fundamental forces that drive price movements in the financial markets. When there is an excess of supply, prices tend to decline as sellers outnumber buyers. Conversely, when there is more demand than supply, prices tend to rise as buyers outnumber sellers.
Footprint charts allow traders to visualise these forces in action, providing a real-time view of the transactional activity at each price level. By observing the volume profiles and price behaviour on the chart, traders can identify areas of significant supply or demand.
For instance, when there is a concentration of high-volume bars at a specific price level on the footprint chart, it suggests that significant buying or selling activity took place at that level. This indicates a level of supply or demand that may act as support or resistance in future price movements.
Additionally, traders analyse the intensity and duration of the volume clusters on the footprint chart. If the volume clusters are narrow and short-lived, it suggests a temporary imbalance between supply and demand. Conversely, if the clusters are wide and sustained, it indicates a more significant market imbalance.
Market balance refers to the equilibrium between supply and demand. Traders aim to identify periods of balance and imbalance using footprint charts. When the market is in balance, the volume clusters are spread evenly across the price spectrum. This indicates a lack of significant supply or demand and suggests a period of consolidation or range-bound trading.
On the other hand, periods of imbalance occur when there is a noticeable discrepancy between supply and demand. Imbalances can result in strong price movements and trading opportunities. By identifying these imbalances on the footprint chart, traders can position themselves on the side of the dominant market forces and capitalise on potential price trends.
It's important to note that supply and demand levels identified on the footprint chart should be confirmed with other technical analysis tools and market indicators. Combining footprint chart analysis with tools like support and resistance levels, trend lines, and price patterns can offer a more comprehensive understanding of market dynamics.
Furthermore, understanding the context and market structure is crucial when analysing supply, demand, and market balance. Traders should consider the larger timeframe charts and macroeconomic factors that influence supply and demand dynamics. This comprehensive approach can help traders make more accurate predictions and improve trading outcomes.
Understanding supply, demand, and market balance is vital for successful trading. Footprint charts provide traders with a valuable tool to visualise these dynamics in real-time, aiding in the identification of key levels and potential trading opportunities. By combining footprint chart analysis with other technical analysis tools, traders can gain a holistic view of market conditions and make more informed trading decisions.
Interpreting the Market's Story for Informed Trading Decisions
The financial markets are constantly evolving and driven by various factors. As traders, it is crucial to interpret the story that the market is telling us through the data provided by footprint charts. By analysing and deciphering this story, traders can make more informed trading decisions. In this chapter, we will explore the process of interpreting the market's story using footprint charts.
Footprint charts offer a unique perspective on the behaviour of market participants and provide insights into their intentions and actions. By closely examining the volume, price movements, and order flow dynamics on the footprint chart, traders can begin to piece together the market's narrative.
One of the key aspects of interpreting the market's story is understanding the concept of market structure. Market structure refers to the arrangement and organisation of price levels and patterns on the chart. Traders analyse the footprint chart alongside other technical analysis tools to identify support and resistance levels, trend lines, and chart patterns.
Market structure helps traders understand how buyers and sellers interact with price levels and how these interactions shape future price movements. By assessing the strength or weakness of support and resistance levels on the footprint chart, traders can identify potential breakout or reversal opportunities.
Alongside market structure, it is essential to analyse the overall market context. This includes considering macroeconomic factors, news events, and market sentiment. By analysing the market context, traders can gain a deeper understanding of the external forces influencing the market's story.
When interpreting the market's story through footprint charts, traders look for key patterns and clues that reveal the intentions of market participants. They pay close attention to changes in volume, the aggressiveness of buying and selling, and the presence of trapped participants.
Changes in volume can indicate shifts in market sentiment and the emergence of new trends. A strong price move and an increase in volume point to a high level of conviction among market participants, whereas a decline in volume could indicate a lack of interest or indecision.
The aggressiveness of buying and selling is another crucial factor. Footprint charts display the execution of orders, allowing traders to identify aggressive buying or selling activity at specific price levels. This information can help discern market sentiment and indicate the level of participation by institutional traders or other significant market players.
Trapped participants are those who entered the market at unfavourable prices and are now trapped in losing positions. Footprint charts can reveal these trapped participants through the presence of volume clusters at specific price levels. Traders can then anticipate potential price rejections or reversals as these trapped participants may look to exit their positions.
It's important to note that interpreting the market's story through footprint charts requires practice, experience, and a keen eye for detail. Traders should continuously refine their skills in understanding market dynamics and interpreting the data presented on the chart.
Interpreting the market's story through footprint charts is a crucial component of making informed trading decisions. By analysing market structure, considering the broader market context, and paying attention to volume, aggressiveness, and trapped participants, traders can gain valuable insights into the market's intentions and tendencies. Incorporating this analysis into trading strategies can improve overall trading outcomes.
Or
You can just join our account management program and relax. We will make at least 1% profit for you on your account – Check out how by clicking on the link below.
Have fun trading!
Have a great journey, and may you catch some big waves on your way to prosperity!
To see this for real, click here.
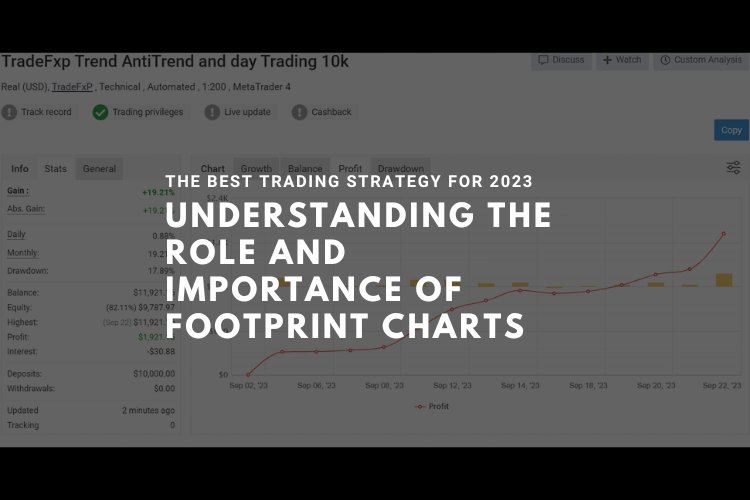
https://www.myfxbook.com/members/SankarGanesan/tradefxp-trend-antitrend-day-trading/10404725
To read why you should be with us, click here
To open an account, click here.
To see our regulation certificate: click here.
To see our news with the IFMRRC: click here.
For claims, click here.
For the main site: click here.
For blogs and articles: click here.
Main Website: www.tradefxp.com